Performance Monitor
The following charts provide a quick reference for monthly and year-to-date performance of various asset classes and how those returns interact when combined within our model portfolios.
We believe in passive investment management and therefore don’t spend a lot of our time analyzing the economic cycle, worrying about current capital market valuations relative to our own estimates, or forecasting short-term returns for individual securities, sectors, or geographic regions. Instead, we focus on establishing long-term (i.e. 10+ years) return assumptions for broad asset classes and constructing model portfolios that we expect will provide our clients with efficient returns over that time frame.
Despite our focus, monitoring the short-term performance of capital markets can be useful to assess whether returns are evolving in line with longer-term assumptions. We update several charts each month to provide clients with a quick reference for monthly and year-to-date performance (in Canadian dollars terms) of various asset classes and how those returns interact when combined within our model portfolios.
If you have any questions or would like to discuss recent market performance in more detail, please contact your advisor. If you are new to High Level Wealth Management, you can schedule a free introductory appointment to learn more about our investment management approach, understand our financial planning process, and get a clear explanation of our fees.
Performance Charts
Footnotes
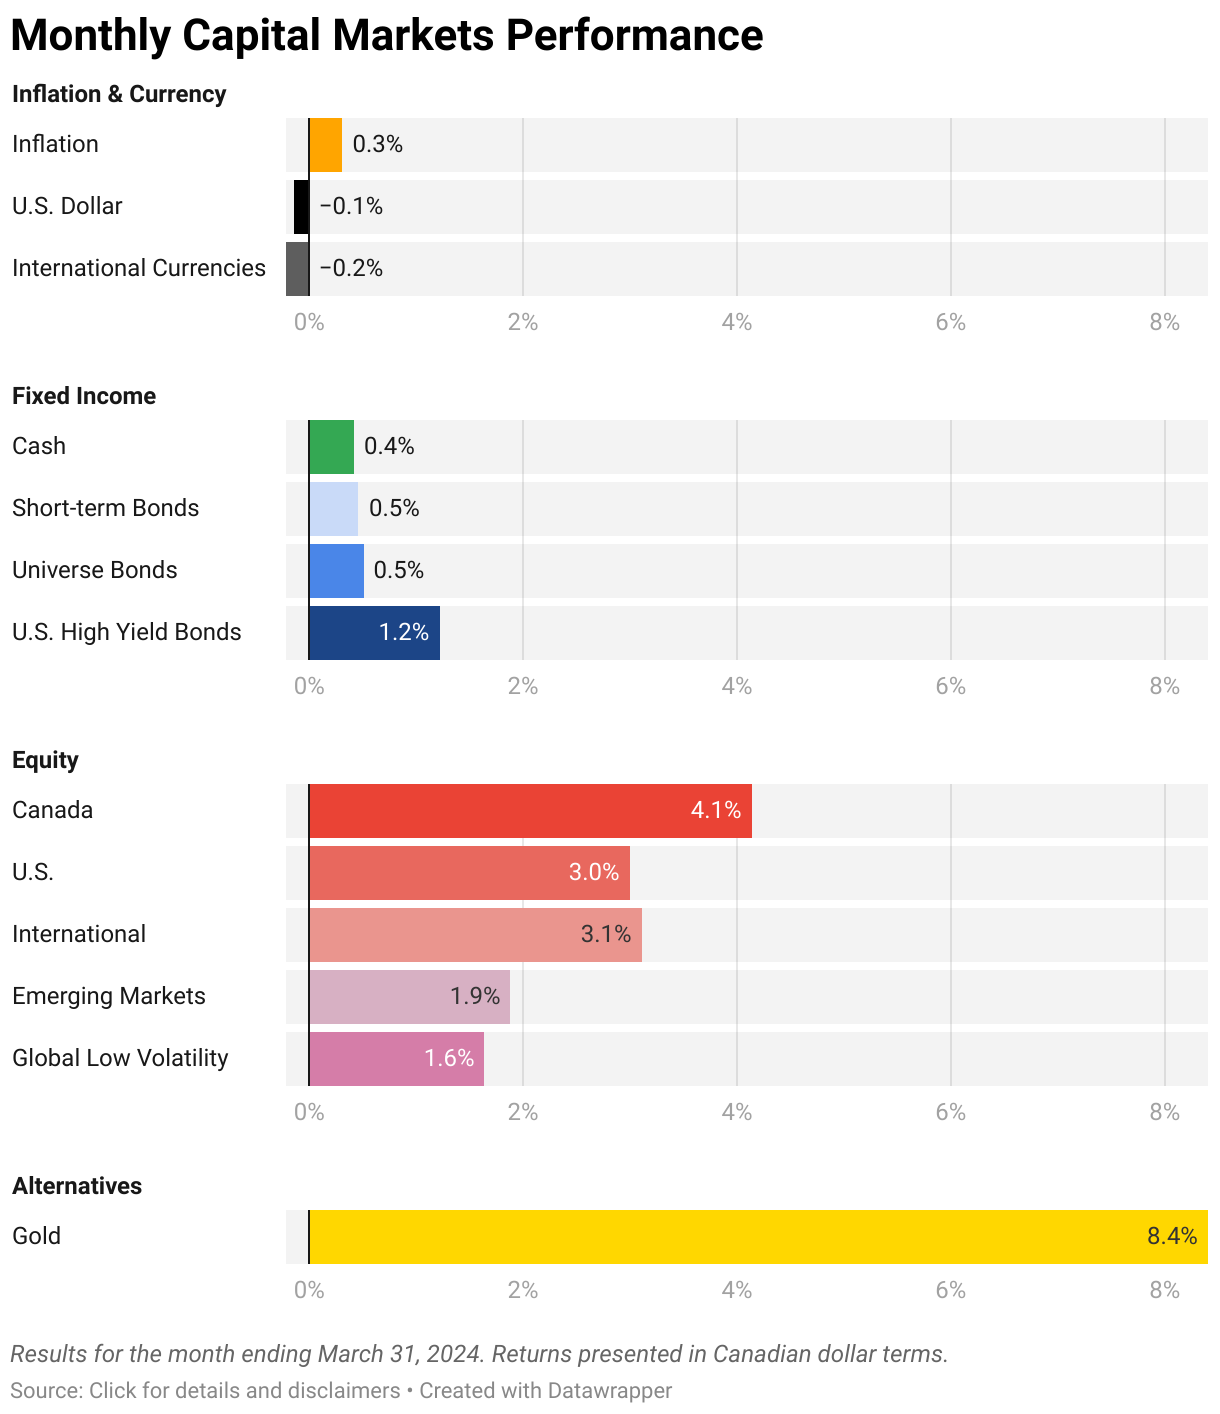
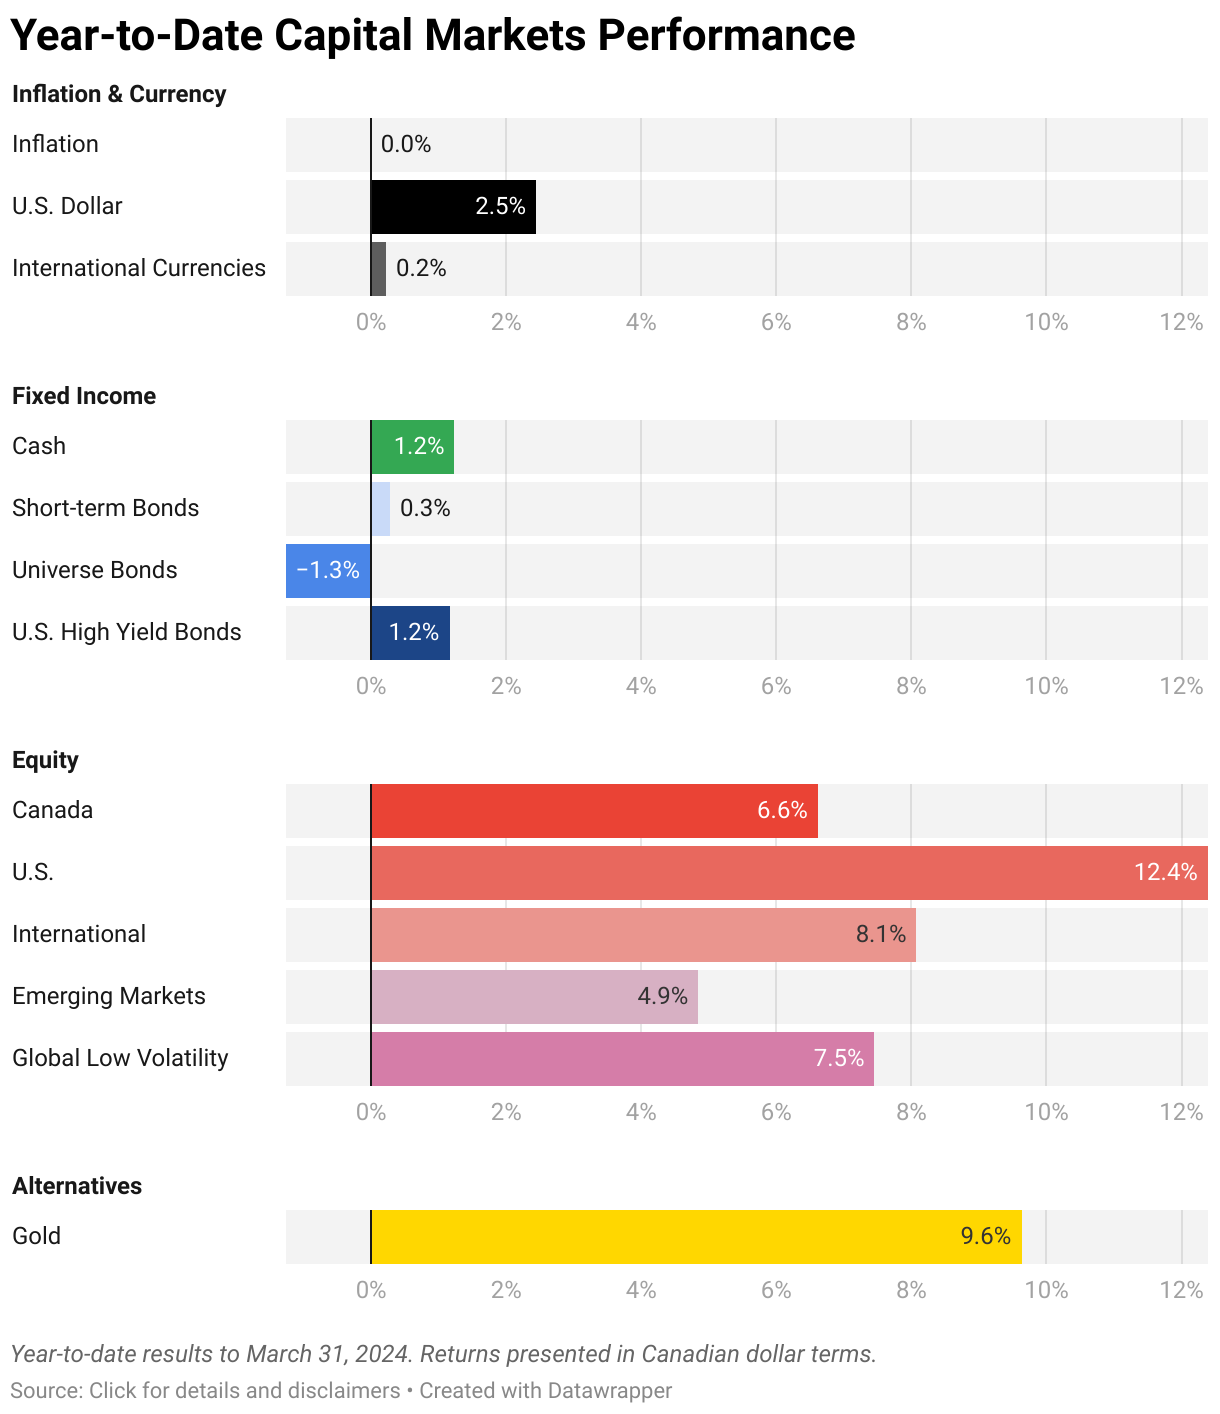
Inflation & Currency
Inflation: Canada All-Items CPI (1 Month Lag)
U.S. Dollar: Bank of Canada CAD/USD Daily Rate
International Currencies: Bank of Canada Daily Nominal Canada Effective Exchange Rate excluding the U.S. Dollar (Inverted)
Fixed Income
Cash: S&P Canada Treasury Bill Index
Short-term Bonds: Solactive Broad Canadian Short Term Bond Universe Index
Universe Bonds: Solactive Broad Canadian Bond Universe Index
U.S. High Yield Bonds: Markit iBoxx USD Liquid High Yield Index (CAD Hedged)
Equity
Canada: S&P/TSX Capped Composite Index
U.S.: CRSP US Total Market Index (CAD)
International: MSCI EAFE Investable Market Index (CAD, net of withholding taxes)
Emerging Markets: MSCI Emerging Markets Investable Market Index (CAD, net of withholding taxes). Prior to December 2023: MSCI Emerging Markets Index (CAD, net of withholding taxes)
Global Low Volatility: MSCI All Country World Minimum Volatility Index (CAD, net of withholding taxes)
Alternatives
Gold: LBMA Gold Price (CAD, AM Price)
It is not possible to invest in a benchmark or index directly and returns do not reflect the transaction costs or management fees that an investor would incur when investing in a financial product, such as an exchange-traded fund, that attempts to track the performance of a benchmark or index.
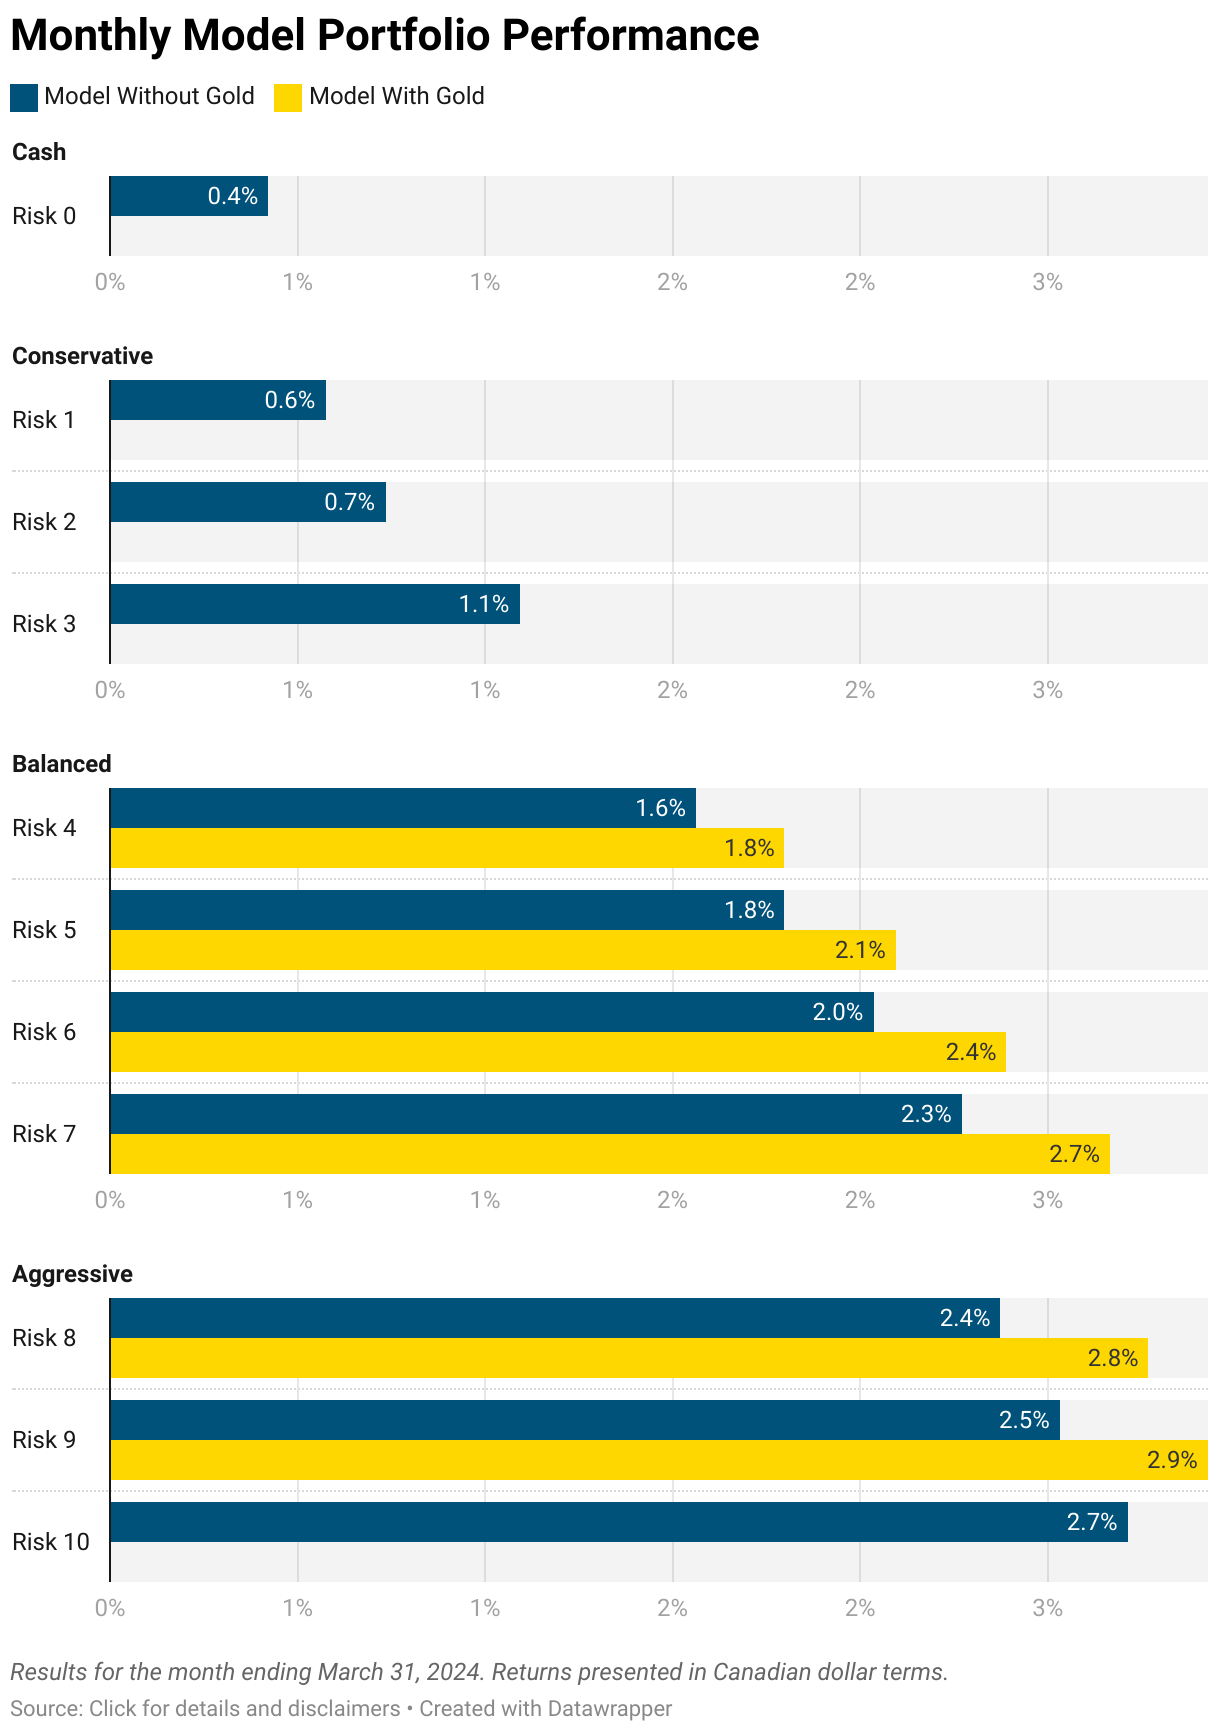
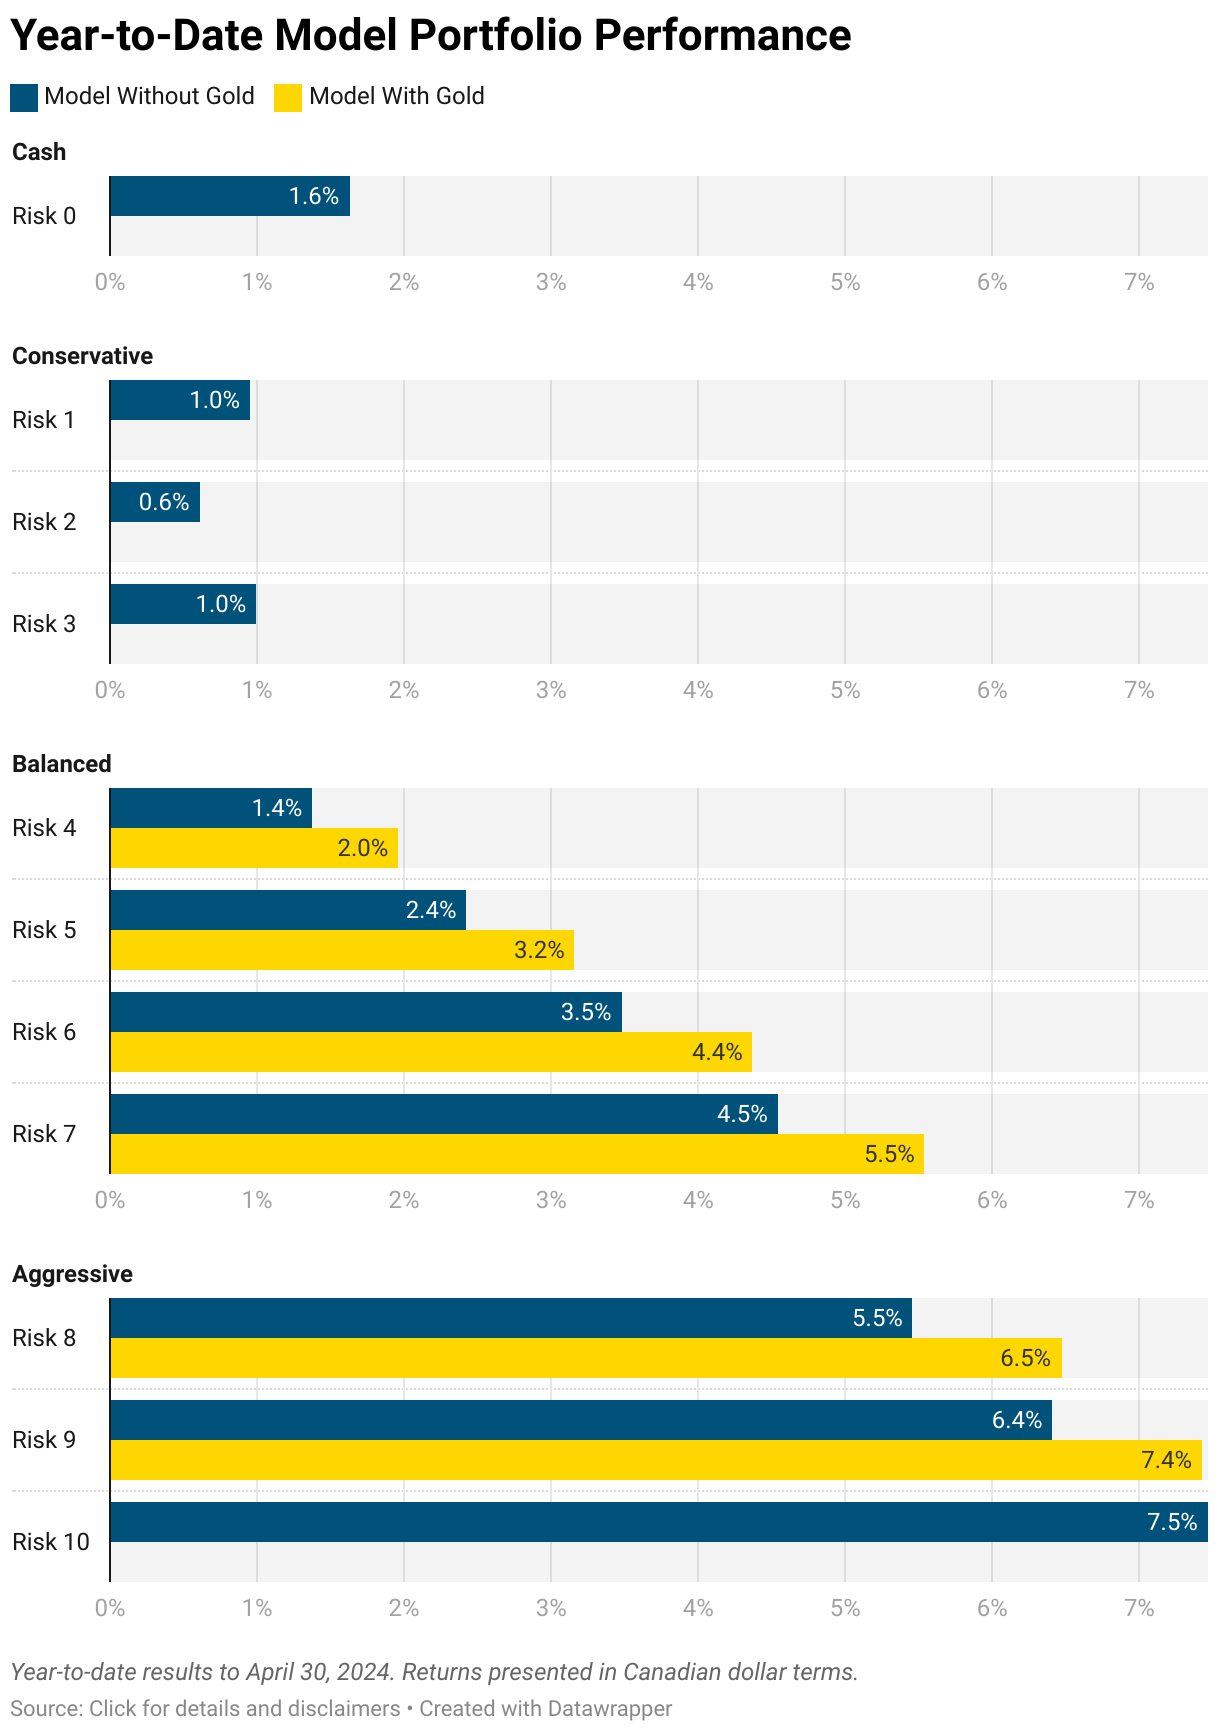
Model portfolio returns are calculated as an average of underlying asset class returns weighted by each model portfolio’s target asset allocations. Returns presented are hypothetical because it is not possible to invest in a benchmark or asset class index directly and the returns presented do not reflect the transaction costs or management fees that an investor would incur when investing in a financial product, such as an exchange-traded fund, that attempts to track the performance of a benchmark or asset class index.
Clients’ actual returns will vary based on their management fees and the timing of cash flows into and out of their respective accounts. Model portfolio performance also assumes that asset class weightings are held constant while in practice an account’s asset allocation may deviate from targets within a reasonable range.